Net Promoter Score® (NPS®) and why you should be using it!
The Net Promoter Score® (NPS®) is a widely used method to measure customer loyalty to a brand, company, product or service and to establish a benchmark. NPS involves asking customers to rate their experience against a single, high level, question.
“How likely is it that you would recommend our company/product/service to a friend or colleague?”
A scale of zero to 10 is used, with typical labels of “0. Not at all likely” and “10. Extremely likely”. The remaining values in the scale are not given a label. The NPS is then calculated and the score can range from -100 to +100. Positive values correspond to greater customer loyalty, while negative values indicate potentially more serious issues. NPS provides a single metric for organisations to focus on.
The NPS question may be followed by an open ended question or additional quantitative questions to gather more feedback and understanding for the NPS.
Spark Chart provides the tools to quickly set up a Net Promoter Score survey, distribute the surveys and analyse and calculate the NPS.
Where NPS came from
The Net Promoter® Score was developed in 2003 by Frederick F. Reichheld and published in the Harvard Business Review article The One Number You Need To Grow. Since then, usage has soared and is now widely used across the world. NPS is renowned for it’s simplicity, the benchmark it provides and the ease of interpretation.
There are two types of NPS surveys: Relationship surveys aim to get a score linked to the overall brand or company. Transaction surveys capture satisfaction with a transaction or an experience.
The value of NPS lies in the focus on a single metric at the highest level
Net Promoter Score provides management with a single metric of the overall performance of their organisation, a product or a service. There is no distraction. The metric will go up or down based on the performance and actions taken by the management and staff in the organisation. Management can set a target NPS and then design and implement action plans to achieve the target.
Success is determined by the action taken
Simply reviewing the Net Promoter Score periodically will not, by itself, generate value for a business. Instead, the NPS target and result should drive organisational plans and actions.
“There is nowhere to hide.”
Each customer, happy or unhappy, has an economic effect on a business. Promoters will likely give repeat business, thereby reducing the amount spent on marketing, as well as promoting a brand to potential customers. Detractors yield the opposite effect. They are likely to negatively affect a business by contacting support staff and using up time dealing with issues or by tarnishing a brand negatively by word-of-mouth.
A primary value of the NPS survey is to identify action for each customer demographic
- Convert Detractors into Passives.
- Move Passives into Promoters.
- Determine why Promoters are so positive.
Focusing on, and improving, NPS can lead to increased profitability and produce an overall better company/brand image. Increasing the NPS can create more leads, convert once-off customers into repeat business and identify key points of product and service differentiation.
How to calculate the Net Promoter Score
For a traditional Net Promoter Score survey, respondents are asked a single question with an 11-point scale: “On a scale of 0 to 10, how likely are you to recommend this company’s product or service to a friend or a colleague?” Responses are then split into three distinct groups:
Promoters with a score of 9 or 10. They love your brand and will be repeat buyers. They will go out of their way to promote a company, brand, product or service to potential buyers.
Passives with a score of 7 or 8. These peoples tend to be indifferent with a company, brand, product or service. They may be satisfied but are not actively promoting or speaking negatively about the product or service unless actively prompted. They could easily switch to a competitor if given incentive.
Detractors with a score of 6 or less. These people are unhappy or unimpressed and aren not likely to purchase the product or use the service again. There is a real possibility that these respondents will tarnish the business, service or product through negative word of mouth.
The Net Promoter Score calculation is:
NPS = (% of Promoters) – (% of Detractors)
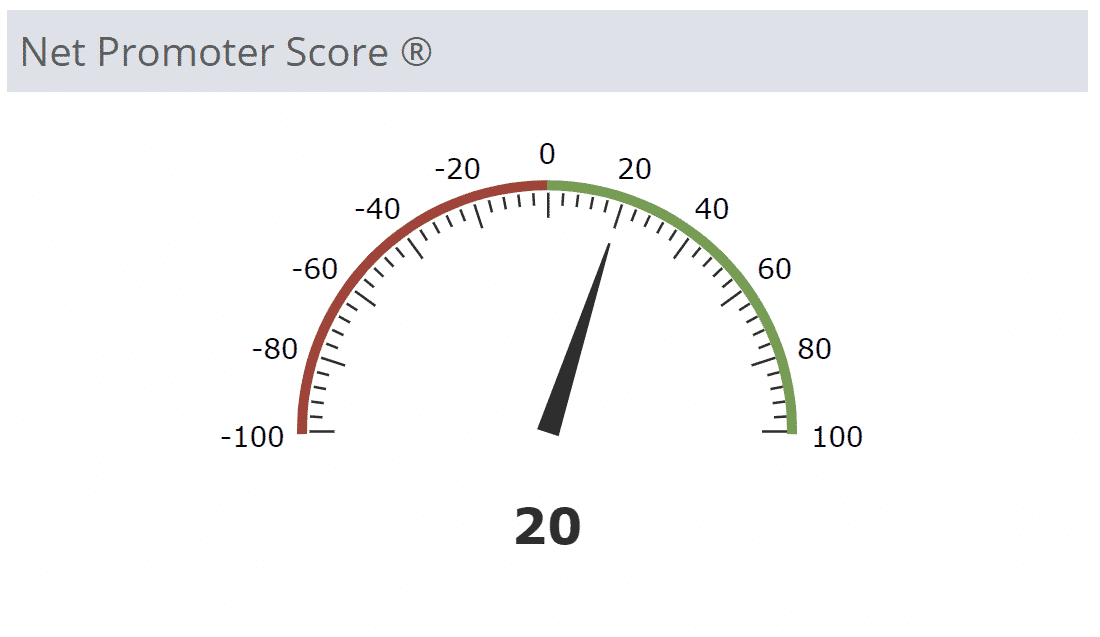
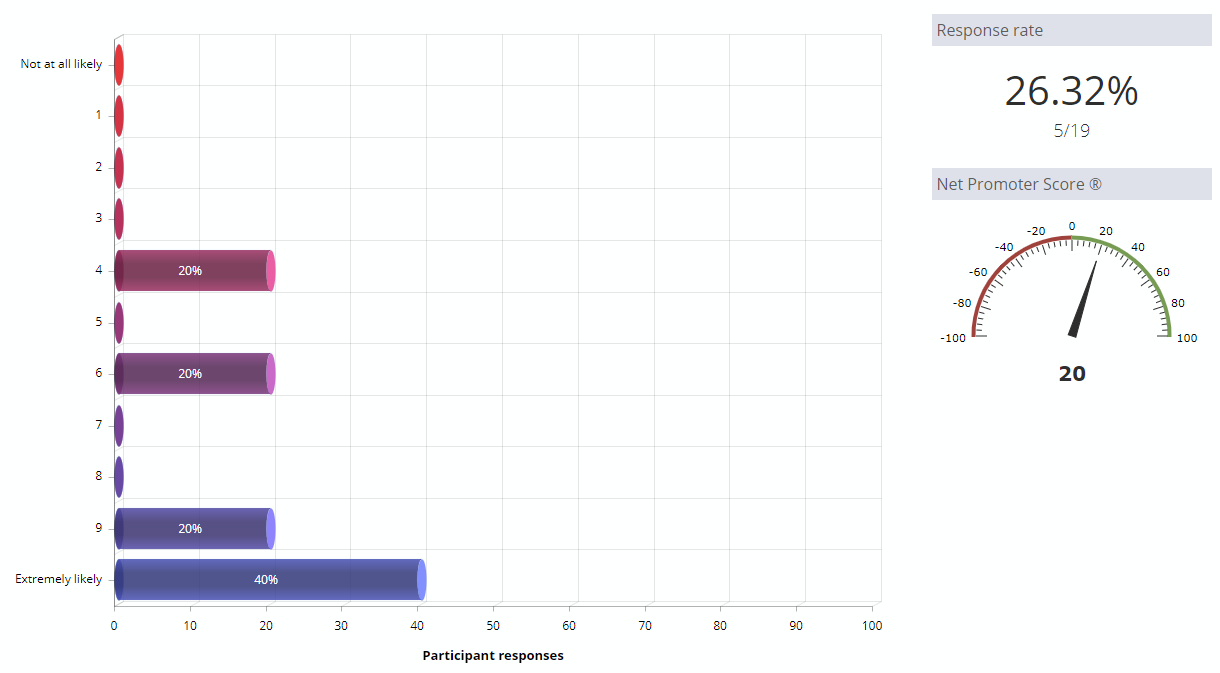
The result will range anywhere from +100 (for all respondents being promoters) to -100 (for all respondents being detractors). For example, let’s say there are 10 respondents. 3 respondents are detractors, 2 are passives and 5 are promoters. The resulting NPS would be +20. I.e. 50% promoters less 30% detractors = +20.
Example: No Passives, 60% Promoters – 40% Detractors = NPS of 20
Interpreting the Net Promoter Score
NPS is easy to score, interpret, quantify and benchmark. Hence it’s widespread adoption. Be aware that benchmarks vary across industries and markets. So, ask Spark Chart for a relevant benchmark to compare against. At the end of the day, an organisation’s current and historical NPS, along with competitor Net Promoter Scores, create the most important benchmarks.
Positive NPS tends to indicate that a business is healthy and will continue growing. However, a negative score might signal that a business has customer service and loyalty issues that should be addressed. Simplifying the significance of the NPS to simply reading positive and negative values is naive however. There are some other really important considerations when interpreting the survey results.
So, what is a good Net Promoter Score? Below is a guide to NPS scoring and you can read more here about interpreting Net Promoter Score benchmarks.
- -100 – 0: Definitely needs improvement
- 0 – 30: Good
- 30 – 50: Very good
- 50 – 70: Excellent
- 70 – 100: Great
Some considerations
Timing is important
Where and when customers are asked to answer the survey can impact upon the results. Although the purpose of a NPS survey is to gather information about the company as a whole, customers will often be more heavily biased towards experiences they’ve had recently. Asking customers to complete a survey directly after purchasing a product or service will likely result in information that is skewed toward that particular experience. Waiting until customers have had the opportunity to use a product on their own will give feedback on the product itself. So, timing and context are important considerations when measuring NPS.
The Net Promoter Score does not paint an entire picture
By it’s very nature, the NPS is simplistic. An entire customer experience is distilled to a single value. As a result valuable information may not be obtained in the process and further investigation is usually required. One way to mitigate this situation is to include optional follow up questions in the survey.
Passives are not considered
Not all customers will love or hate a company, brand, product or service. Many will simply be passive, which is reflected in their scoring of 7 or 8. One issue with the Net Promoter Score is that Passives are essentially disregarded in the analysis. Their responses are excluded from calculations. Although not as valuable as the Detractors and Promoters, they can often express their experience with less emotion and give more unbiased feedback.


